UHC Data Portal Updates: OCT 2023
UHC, October 26, 2023
The UHC Research and Data Core is actively working to expand which data from the repository are available; reach out to UHCdata@drexel.edu with any specific requests. All available data will be updated as possible by the UHC Research and Data Core.
New Added Dataset
• Tree Canopy for Contiguous US in years 2011, 2016, and 2019:
Tract average percent tree canopy was available on the UHC Data Poral for the metropolitan Philadelphia area. UHC R&D has updated this dataset to include the entire contiguous US. An additional year 2019 is now also available.
For the portal, we have focused on compiling tract measures of greenness for the contiguous US from the 30 m resolution National Land Cover Dataset (NLCD). Percent tree canopy and percent developed impervious are available for each 30 m by 30 m cell and the UHC calculated the mean of these cells for each census tract (Figure 1, Figure 2). Each cell is also assigned a land cover category and the UHC calculated percent of cells in categories considered green (e.g. forest, grassland) for each census tract (Figure 3). Average percent tree canopy and percent green are correlated, but a cell with a building surrounded by trees might be 50% tree canopy and classified as developed and not considered green. Average percent impervious and average percent tree canopy are inversely correlated (Figure 4).
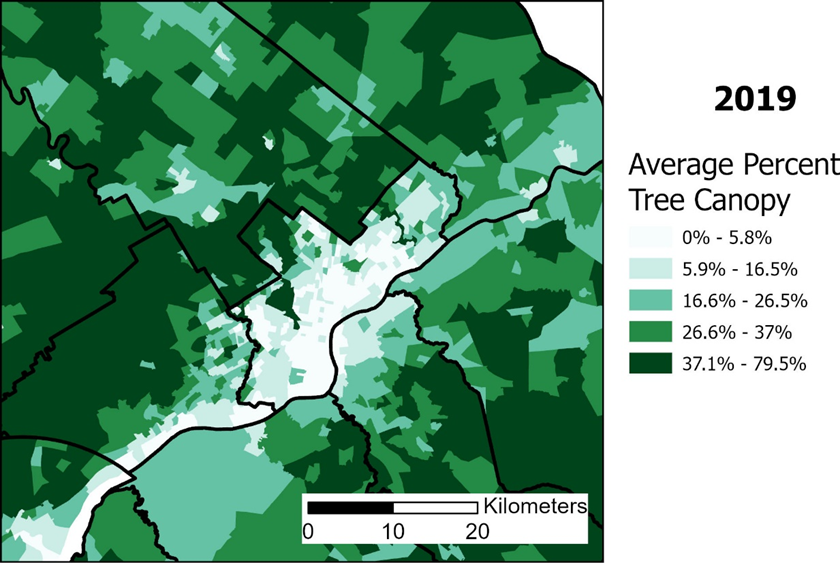
Figure 1 : Philadelphia and vicinity average percent tree canopy by tract 2019
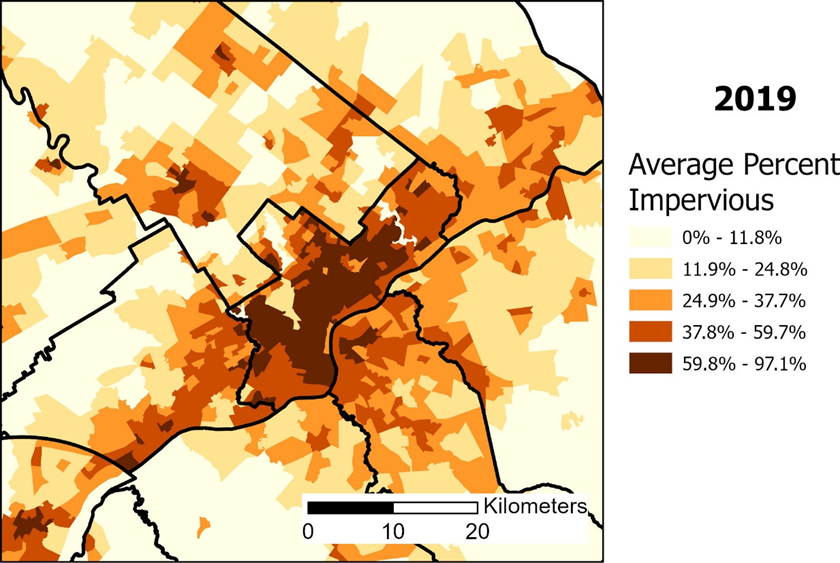
Figure 2: Philadelphia and vicinity average percent impervious by tract 2019

Figure 3: Philadelphia and vicinity percent green by tract 2019
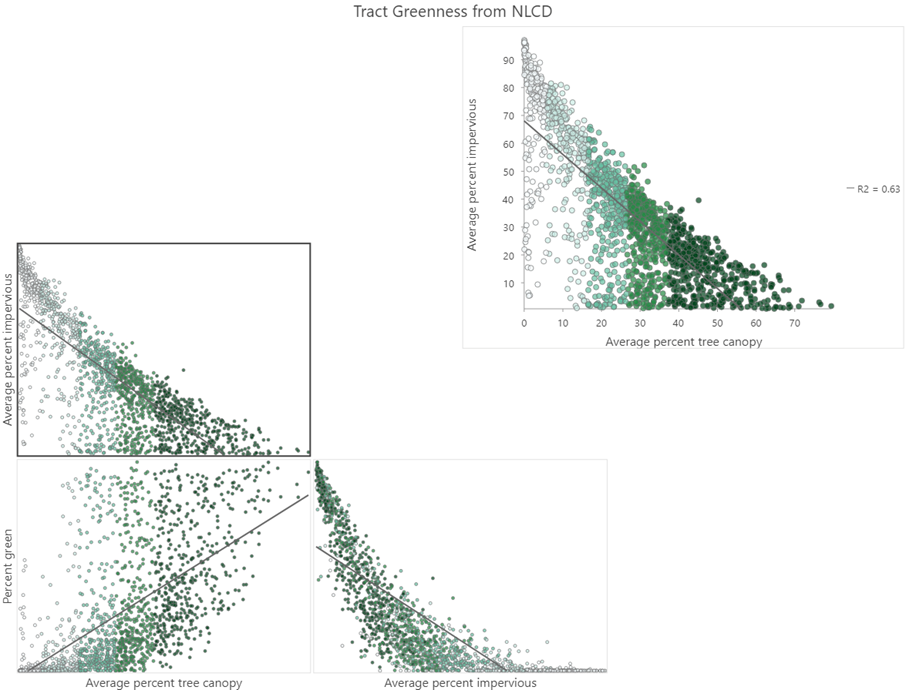
Figure 4: Scatterplot Matrix Tract Greenness Measures 2019 Philadelphia Reading Camden Combined Statistical Area